M3A
Project Dataset
M3A (Multipath Multicarrier Misinformation to Adversaries) is a multi-antenna multicarrier OFDM/OFDMA transmission system that allows the sender (Alice) to deliver data symbols to legitimate users (Bob) while simultaneously sending misinformation to eavesdroppers (Eve). As a result, the decoded sysbols at Eve are positioned randomly across the I-Q plane. Meanwhile, the data symbol integrity at Bob is still successfully retained. To achieve these, M3A adopts a novel digital baseband algorithm and exploits rich multipath characteristics of physical channels within the Sub-6GHz frequeny range. The dataset contains the performance metrics such as SNR, EVM, and BER at both Bob and Eve at different locations and proximity to each other when M3A versus beamforming was used.
Dataset Description
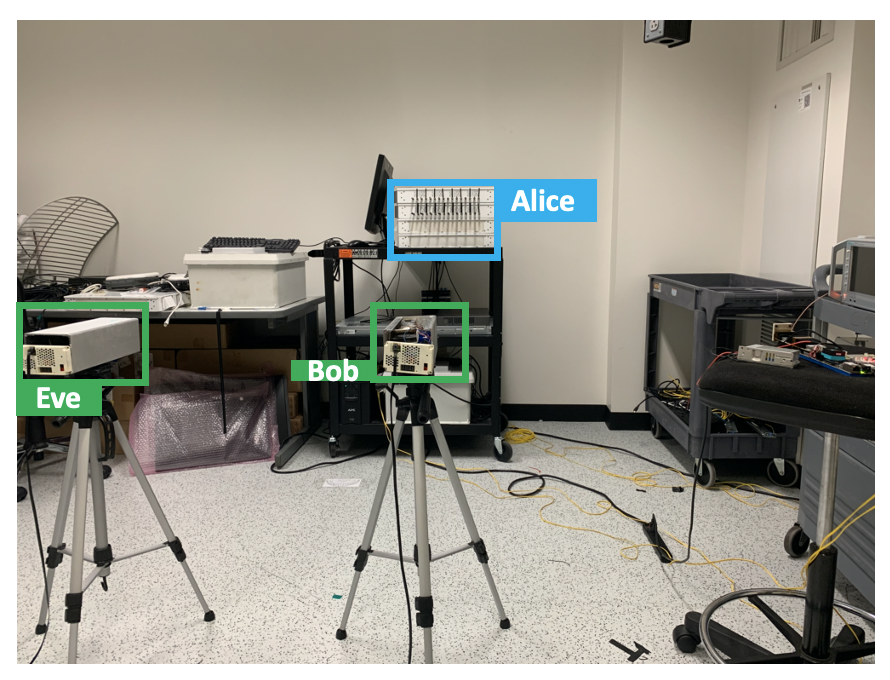
This dataset was collected by Zhecun Liu from Rice University, in a typical lab room that consists of multiple objects, namely chairs, tables, and numerous other objects which create a natural multipath environment. The setup is shown in figure below, which contains two user nodes (UE) and one base-station (BS). The BS consists of four main components: a radio head, a hub unit, a reference node, and a multi-core server. The BS and two Iris UEs are configured to be Alice, Bob, and Eve respectively. A reference node outside the array (and synchronized) has been included for reciprocity calibration.


The dataset compares the reliability and security performance of M3A and its variants against downlink conjugate beamforming as the baseline, over 20 locations for different Alice-Bob/Eve channels. In test topology shown below, there is an obstacle near location 20, deteriorating signal strength between Alice and Bob there.
We use a fixed 16-QAM modulation during the experiments.
Operational parameters such as amplifier gains, modulation order, and the number of subcarriers, are configured using JSON files.
Alice adopts a TDD-based transmission protocol, as illustrated in timeline figure below.
Note that we configure Bob and Eve so that they send their uplink pilot, for the CSIT acquisition, in different times (indicated by the transmission slot P).
Since Alice is configured to activate her reception window (highlighted below) during only Bob's P slot that , both Alice and Bob essentially are agnostic to the presence of Eve.
Finally, Bob and Eve both are in receive state, when Alice sending downlink signals during the three D slots.
The first D slot carries a preamble symbol, allowing a receiver (Bob and Eve) calculate the CSIR and equalize the channel.
HDF5 files analysis using MATLAB Scripts
In this section, we provide some examples for using MATLAB scripts to analyze and plot PHY data in HDF5 files. The MATLAB scripts can be found in the Agora GitHub repository.
- Run function
inspect_single_frame(dataset_filename, inspect_frame, verbose)in MATLAB command window; where the first argument is the name of h5 file to analyze, second argument the specific frame number, and verbose should betrueto disply h5 file attributes - Below shows example output figures by running
inspect_single_frame("UeRxData-loc10.h5", 999, "false"), including the receive constellation plot at Eve over two downlink transmissions, receive time-domain waveform, symbol detection error matrices, and the magnitude and phase of the effective CSIR.

Data Copyright and License
Rice University hereby grants you a non-exclusive, non-transferable license to use the data for commercial, educational, and/or research purposes only. You agree to not redistribute the data without written permission from Rice University.
You agree to acknowledge the source of the data in any publication or product reporting on your use of it.
We provide no warranty whatsoever on any aspect of the data, including but not limited to its correctness, completeness, and fitness. Use at your own risk.
You agree to acknowledge the following two publications:
- Zhecun Liu, Keerthi Dasala, Di Mu, Rahman Doost-Mohammady, and Edward Knightly, "M3A: Multipath Multicarrier Misinformation to Adversaries," in Proc. ACM Mobicom, Oct. 2023
- Rahman Doost-Mohammady, Oscar Bejarano, Lin Zhong, Joseph Cavallaro, Edward Knightly, Z. Morley Mao, Wei Wayne Li, Xuemin Chen, Ashutosh Sabharwal, "RENEW: Programmable and Observable Massive MIMO Networks," 2018 52nd Asilomar Conference on Signals, Systems, and Computers, Pacific Grove, CA, USA, 2018, pp. 1654-1658, doi: 10.1109/ACSSC.2018.8645391.
NOTE: Downloading, obtaining, and/or using the data in any means constitutes your agreement with these terms.
BibTeX entry:
@inbook{3613282,
author={Liu, Zhecun and Dasala, Keerthi Priya and Mu, Di and Doost-Mohammady, Rahman and Knightly, Edward W.},
booktitle={Proceedings of the 29th Annual International Conference on Mobile Computing and Networking},
title={M3A: Multipath Multicarrier Misinformation to Adversaries},
year={2023},
articleno={81},
doi={10.1145/3570361.3613282}}
@INPROCEEDINGS{8645391,
author={Doost-Mohammady, Rahman and Bejarano, Oscar and Zhong, Lin and Cavallaro, Joseph R. and Knightly, Edward and Mao, Z. Morley and Li, Wei Wayne and Chen, Xuemin and Sabharwal, Ashutosh},
booktitle={2018 52nd Asilomar Conference on Signals, Systems, and Computers},
title={RENEW: Programmable and Observable Massive MIMO Networks},
year={2018},
pages={1654-1658},
doi={10.1109/ACSSC.2018.8645391}}
Data
- Directory
M3A-data/Data-reliabilityExp/XX/loc#represents the collected PHY status per TDD frame using beamforming scheme XX when Bob is at location # (XXcan be eitherBF,FASM,M3A, orM3Alcand#can be any integer from 1 to 20). Here, we solely consider Alice and Bob to study the reliability at Bob, and we adopt Bob's BER as the performance metric. At the end of log file within the directory, the BER is calculated based on 1,000 transmitted TDD frames. At each location, we repeated such transmission consecutively five times to transmit 5,000 frames before moving to the next location. We then switched to different beamforming strategies, after finishing all 20 locations. - Directory
Now we introduce Eve into the system and evaluate how well does M3A protect against passive eavesdropping.
We adopt Eve’s BER values as a metric.
M3A-data/Data-securityExp/security-M3A/LOG_FILEScontains collected PHY status per TDD frame when Eve is located at one of the 20 locations (while Bob is at location-8).M3A-data/Data-securityExp/security-M3A/TXT_FILESreports BER metric directly. In addition, we further collected HDF5 files which contains fine-grained PHY statistics (e.g., the receive constellations) inM3A-data/Data-securityExp/security-M3A/H5_FILES. The detailed instruction on how to analyze them using scripts are given in later section. As a comparison, we repeated the experiment using BF; the data is stored inM3A-data/Data-securityExp/security-M3A/. - Directory
M3A-data/Data-wavelengthExp/dir/M3A/xlamcontains Eve's log file and .h5 file when Eve is ofxunit of wavelengths distance away from Bob along directiondir. There are six different directions in this measurement, and see below a 3D view of experimental setup with distances normalized with respect to carrier wavelength.